When More Data Means Less Visibility: Rethinking Incident Detection in Telemetry-Heavy Environments
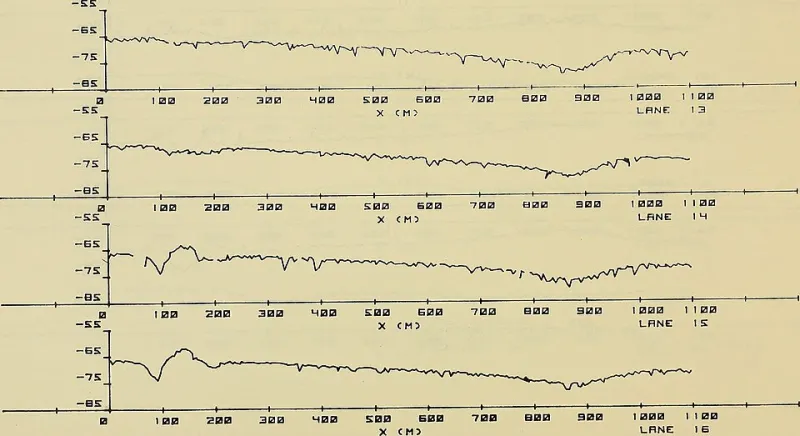
Photo: Naval Underwater Systems Center (U.S.); United States. Army. Corps of Engineers. New England Division, No restrictions, via Wikimedia Commons
There is a persistent assumption in the observability space that collecting more data will naturally lead to better operational awareness. Dashboards proliferate, metrics pipelines expand, and log retention windows grow — yet on-call engineers still receive frantic calls from customers who discovered a production failure before any automated alert fired. The contradiction is striking: how can a team be simultaneously data-rich and operationally blind?
The answer lies not in the volume of telemetry, but in how that telemetry is organized, prioritized, and acted upon. This guide examines the structural reasons why high-data environments often produce poor incident detection, and offers concrete strategies for building alert hierarchies that surface real problems rather than bury them.
The Signal-to-Noise Problem in Practice
Consider a mid-sized SaaS platform running across three AWS regions. The observability stack might include Prometheus for metrics, Loki or Elasticsearch for logs, Jaeger for distributed traces, and a commercial APM layer on top. Each tool generates its own alert rules, often configured independently by different team members over time. The result is hundreds of firing alerts on any given weekday — CPU spikes, GC pauses, slow database queries, certificate expiration warnings with 90-day lead times — all routed to the same Slack channel.
When a genuine incident begins, its early indicators arrive in that same channel. They compete with dozens of low-severity notifications that have been firing so consistently they are functionally invisible to the team. This is the signal-to-noise problem in its most damaging form: not the absence of a signal, but its submersion beneath irrelevant noise.
Research in human factors engineering has long established that alert fatigue degrades operator performance in high-stakes environments. The same principle applies to software operations. Engineers who have learned to tune out noisy alerts will also, inevitably, tune out the alert that matters.
Root Cause Analysis Frameworks That Reveal Structural Gaps
Before restructuring an alerting strategy, teams benefit from conducting a retrospective audit of recent incidents using a structured root cause analysis (RCA) framework. Two approaches are particularly effective in distributed systems contexts.
The Five Whys with a Telemetry Lens
The classic Five Whys technique takes on additional value when each "why" is mapped to a specific observability signal. For each causal layer, engineers ask: Was there a metric, log entry, or trace that captured this condition before the incident was declared? If the answer is yes but the signal went unnoticed, the failure mode is organizational — an alerting or routing problem. If the answer is no, the failure mode is instrumentation — a coverage gap.
This distinction matters enormously. Teams frequently invest in new monitoring tools when the actual problem is that existing signals are not being routed or thresholds are not calibrated correctly.
The RED and USE Method Alignment Check
The RED method (Rate, Errors, Duration) applies to request-driven services, while the USE method (Utilization, Saturation, Errors) applies to infrastructure resources. Running both frameworks against a recent incident often reveals which category of signal was present but under-weighted in the alert hierarchy. A service degradation that manifested first as increased request duration before CPU saturation became apparent, for example, indicates that RED-layer alerts should carry higher priority than USE-layer alerts in that specific service context.
Building an Alert Hierarchy That Reflects Business Impact
The most effective alerting architectures are organized around business impact rather than technical symptoms. This requires a deliberate mapping exercise that connects infrastructure signals to user-facing outcomes.
Tier 1: Customer-Impact Signals
These are alerts that, when firing, indicate a customer is currently experiencing a degraded or broken experience. Examples include error rate on public API endpoints exceeding a defined threshold, checkout flow latency above a customer-facing SLA, or synthetic monitor failures from a third-party uptime service. Tier 1 alerts should page on-call engineers immediately, regardless of time of day.
Tier 2: Precursor Signals
These alerts indicate conditions that are likely to produce customer impact within a defined time window — typically minutes to hours. Database connection pool exhaustion trending toward the limit, memory growth rates that project an OOM event within 30 minutes, or a degraded replica in a primary-replica database setup all belong here. Tier 2 alerts warrant immediate investigation during business hours and a lower-urgency page outside of them.
Tier 3: Informational and Trend Signals
Everything else — including the noisy, chronic alerts that have been firing for months — belongs in a tier that is reviewed asynchronously. These signals may be valuable for capacity planning or long-term reliability improvement, but they should not compete for attention with Tier 1 and Tier 2 notifications.
Practical Steps for Reducing Alert Fatigue Without Losing Coverage
Restructuring an existing alert landscape is disruptive, and many teams hesitate because they fear losing coverage during the transition. The following approach minimizes that risk.
Conduct an alert audit over a 30-day window. Export every alert that fired during the period and categorize each by the action it prompted. Alerts that were acknowledged and then immediately closed without any remediation action are strong candidates for demotion to Tier 3 or outright deletion.
Implement alert dependency grouping. Most modern alerting platforms, including PagerDuty, OpsGenie, and Grafana Alerting, support some form of alert grouping or inhibition rules. Configure parent-child relationships so that a downstream symptom alert is suppressed when its upstream cause alert is already firing. This alone can reduce notification volume by 30 to 50 percent in complex microservice environments.
Establish a monthly alert review ritual. Assign ownership of the alerting configuration to a named individual or small rotation. Schedule a recurring review where recently fired alerts are evaluated for accuracy and relevance. Treat the alerting configuration as living documentation — subject to the same rigor as application code.
Use error budgets to calibrate thresholds. If a service has a defined SLO, the alert threshold for its error rate should be derived from the burn rate against that error budget, not from an arbitrary percentage. This approach, formalized in Google's Site Reliability Engineering practices, ensures that alerts reflect actual reliability commitments rather than engineering intuition.
The Operational Mindset Shift
Ultimately, improving incident detection in data-rich environments is as much a cultural challenge as a technical one. Teams must resist the instinct to respond to every missed incident by adding more alerts. The question to ask after each post-incident review is not "what signal were we missing?" but rather "what signal was present, and why did we not act on it?"
Observability infrastructure is only as effective as the operational discipline surrounding it. Data collection is the beginning of the process, not the end. The teams that catch problems before their customers do are not necessarily those with the most comprehensive telemetry — they are the ones who have done the harder work of deciding which signals deserve immediate attention and building systems that make that prioritization automatic.