Connection Pool Architecture in 2024: Choosing the Right Layer for PostgreSQL, MySQL, and Redis

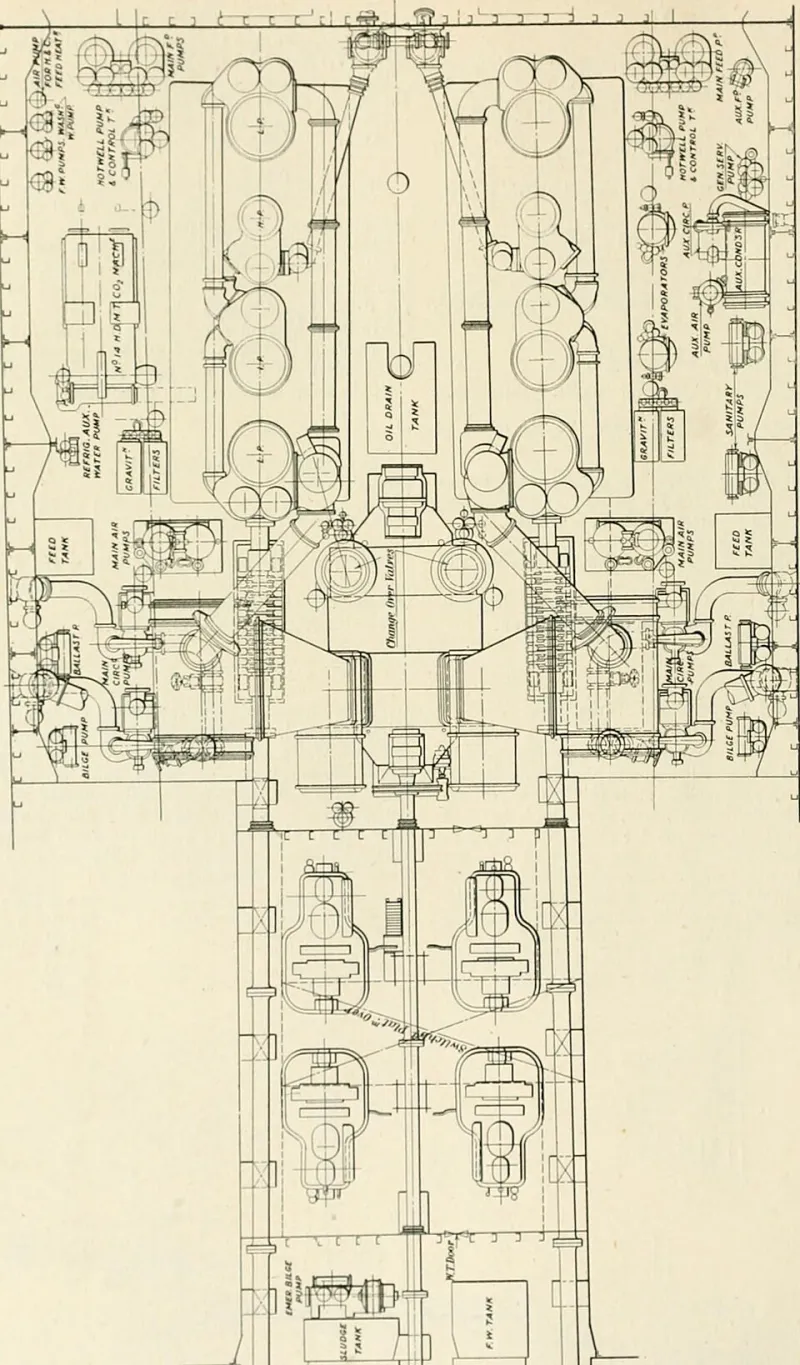
Photo: U.S. Navy, Public domain, via Wikimedia Commons
Connection pool misconfiguration is one of the most reliably underestimated sources of production instability in backend systems. It rarely appears in pre-launch checklists. It is seldom covered in architecture reviews. And yet, a significant proportion of the mysterious application hangs, timeout cascades, and peak-load degradation events that DevOps teams investigate trace back, eventually, to a connection pooling decision made early in a project's life and never revisited.
This guide is not a benchmark comparison. Throughput numbers for PgBouncer, Pgpool-II, and HikariCP are available in abundance and are largely context-dependent. What this guide addresses instead are the operational trade-offs—the monitoring complexity, the failover behavior, the misconfiguration failure modes—that determine whether a pooling architecture actually holds together under production conditions.
Why Connection Pooling Decisions Are Architectural, Not Tactical
The instinct to treat connection pooling as a configuration detail rather than an architectural decision is understandable. Most frameworks provide a default pooler with reasonable defaults, and those defaults work adequately at modest scale. The problem surfaces when traffic patterns change, when database replicas are introduced, or when connection limits become a genuine constraint.
At that point, teams discover that their pooling layer is deeply integrated into application behavior in ways that are difficult to change without significant refactoring. The connection pool sits between application logic and database I/O, which means its failure modes propagate in both directions. A saturated pool looks like application unresponsiveness from the user's perspective and like idle database capacity from the DBA's perspective—a diagnostic mismatch that costs time during incidents.
PostgreSQL: The Case for an External Pooler
PostgreSQL's connection model is one of its most discussed operational characteristics. Each connection spawns a dedicated backend process, which means connection count has a direct relationship to memory consumption and context-switching overhead. In practice, most PostgreSQL deployments begin to degrade at connection counts that would be unremarkable in MySQL environments.
PgBouncer: The Operational Standard
PgBouncer has become the de facto external pooler for PostgreSQL in production environments, and for good reason. Its transaction-mode pooling allows a relatively small number of actual database connections to serve a substantially larger application connection pool, which directly addresses PostgreSQL's per-connection overhead.
The operational trade-offs are worth stating clearly. PgBouncer does not support all PostgreSQL features transparently. Prepared statements require specific configuration in transaction mode, and SET commands do not persist across transactions in the way application code might expect. Teams migrating an existing application to PgBouncer frequently encounter subtle behavioral differences that only manifest in specific code paths.
From a monitoring standpoint, PgBouncer exposes a statistics interface that provides connection counts, wait times, and pool utilization metrics. Integrating this data into your observability stack is essential—without it, pool saturation events are invisible until they manifest as application timeouts.
Pgpool-II: When You Need More Than Pooling
Pgpool-II occupies a different position in the architecture. It provides connection pooling, but also load balancing across read replicas and query routing. For teams operating PostgreSQL clusters with multiple replicas, Pgpool-II can consolidate several operational concerns into a single component.
The operational cost is complexity. Pgpool-II is a substantially more involved system to configure and operate than PgBouncer. Its failover behavior requires careful validation—automated primary promotion in Pgpool-II has historically been a source of split-brain scenarios if watchdog configuration is not correct. Teams should evaluate whether the query routing capabilities justify the operational overhead, or whether a simpler combination of PgBouncer plus application-level read/write splitting better fits their requirements.
RDS Proxy and Cloud-Managed Options
AWS RDS Proxy has matured considerably since its initial release and warrants serious consideration for teams running PostgreSQL on RDS or Aurora. It provides connection pooling with IAM authentication integration, automatic failover handling, and native CloudWatch metrics. For organizations already invested in the AWS ecosystem, the operational overhead is significantly lower than running a self-managed PgBouncer deployment.
The trade-off is cost and latency. RDS Proxy adds a network hop and carries a per-endpoint pricing model that can become meaningful at scale. It also abstracts the pooling layer in ways that can make deep troubleshooting more difficult—when connection behavior is unexpected, the diagnostic path through RDS Proxy is less transparent than with a self-managed pooler.
MySQL: Application-Level Pooling as the Default
MySQL's threading model handles higher connection counts with less overhead than PostgreSQL, which means the urgency of external pooling is lower in many MySQL deployments. Application-level poolers—HikariCP for JVM applications, SQLAlchemy's pooling for Python, connection pool implementations in Node.js drivers—are frequently sufficient for moderate-scale MySQL workloads.
The operational concern with application-level pooling is distribution. In containerized environments with horizontal scaling, each application instance maintains its own pool. The aggregate connection count against the database is the product of instance count and pool size. Teams that scale application instances aggressively without adjusting pool size ceilings can inadvertently saturate database connection limits during traffic spikes—exactly the moment when connection capacity is most critical.
ProxySql is the most widely adopted external pooler for MySQL in production environments that require more sophisticated connection management. It provides query routing, read/write splitting, and connection multiplexing, with a monitoring interface that is notably more accessible than Pgpool-II's.
Redis: A Fundamentally Different Problem
Redis connection pooling operates under different constraints than relational database pooling. Redis is single-threaded for command execution, and its connection handling is lightweight by comparison. The pooling concern for Redis is less about database-side resource exhaustion and more about client-side connection management and network overhead.
The operational failure mode most commonly associated with Redis connection pools is connection leak under error conditions. When application code does not properly return connections to the pool after an exception—a common issue in codebases with inconsistent error handling—the pool depletes gradually. Under normal load, leaked connections are replaced before the pool reaches saturation. Under peak load, the replacement rate cannot keep pace, and the pool exhausts. The application begins queuing requests waiting for available connections, which manifests as latency spikes and eventual timeout errors.
Monitoring Redis pool health requires instrumentation at the client library level. Most Redis client libraries expose pool metrics, but these are not always wired into application monitoring by default. Establishing baseline pool utilization metrics and alerting on sustained high utilization is a straightforward safeguard against this failure pattern.
The Monitoring Gap That Causes Peak-Load Incidents
Across all three databases, the most operationally dangerous misconfiguration pattern is a pool that is sized adequately for average load but insufficient for peak load, with no monitoring in place to detect the approach to saturation. This configuration will operate without incident for extended periods—potentially months—before traffic conditions expose the gap.
The practical recommendation is to instrument pool wait time as a primary signal, not pool utilization. A pool operating at seventy percent utilization with zero wait time is healthy. A pool at fifty percent utilization with measurable wait time is a leading indicator of an impending saturation event. Most pooling libraries and external poolers expose wait time metrics; the operational discipline is ensuring those metrics are collected, visualized, and included in alerting thresholds before the incident that makes them relevant.