What Your Monitoring Stack Is Actually Costing You: The Hidden Burden of Observability Debt
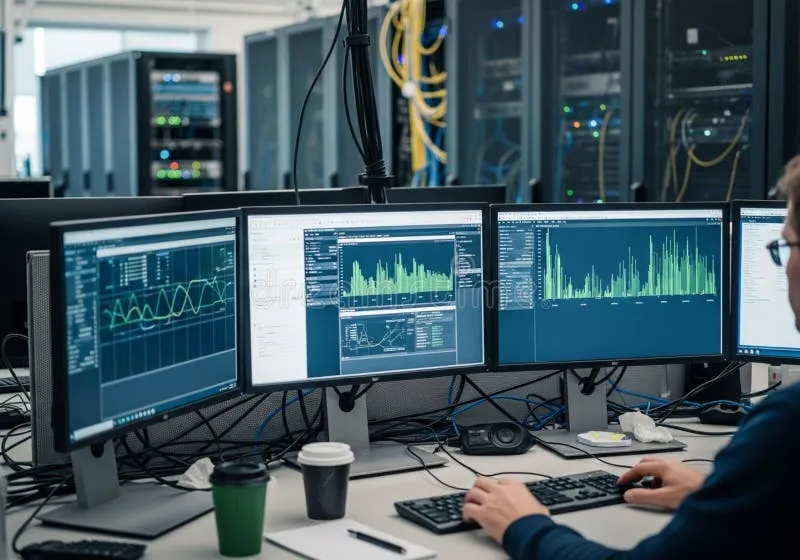
Photo: server monitoring dashboard multiple screens data center operations, via thumbs.dreamstime.com
Most engineering teams can tell you how much they pay for their observability platform. Very few can tell you what their observability practice actually costs. That distinction matters more than most organizations realize, and the gap between those two numbers is where observability debt lives.
Observability debt is not simply a matter of paying for tools you underuse. It is the accumulated weight of architectural decisions made under pressure — a Datadog agent deployed here, a Prometheus scrape job left running there, a Grafana dashboard built during an incident that nobody has opened since. Each of these artifacts carries a cost: in compute, in storage, in engineering attention, and in the cognitive overhead required to maintain a monitoring environment that has grown without a governing plan.
How Fragmentation Happens in Practice
The origin story is familiar. A team adopts a lightweight metrics solution early in a product's lifecycle. As the system scales, a separate logging platform gets introduced. An SRE hire brings familiarity with a third tool. A vendor offers a free tier that gets used for a specific integration and never revisited. Within eighteen months, a mid-sized engineering organization can find itself operating four or five overlapping observability systems, each with its own agent, its own retention policy, its own alerting configuration, and its own per-seat licensing agreement.
This fragmentation is rarely the result of poor judgment. It is typically the outcome of rational decisions made in isolation. The problem is that those decisions are almost never audited in aggregate. Nobody sits down six months later to ask whether the organization still needs both tools, or whether the instrumentation added for a deprecated service has been removed, or whether the retention window set during a compliance review still reflects actual business requirements.
The result is a monitoring stack that expands in one direction only.
The Real Price of Unmaintained Dashboards and Redundant Instrumentation
Consider a concrete scenario. An infrastructure team at a Series B software company runs three separate observability platforms: one for application performance monitoring, one for infrastructure metrics, and one inherited from an acquisition. Each platform ingests data from overlapping sources. The APM tool receives traces from services that are also instrumented for the metrics platform. Both platforms alert on the same error conditions using slightly different thresholds. Nobody has reconciled the two alert sets because doing so requires deep familiarity with both systems.
In this environment, engineers spend time acknowledging duplicate alerts. On-call rotations lose trust in their dashboards because similar metrics display different values depending on which platform they consult. Incident postmortems identify the wrong root cause because the team relied on a dashboard that was built against a data source no longer representative of current system behavior.
None of these costs appear on a line item. They show up as extended mean time to resolution, as engineer burnout, as missed SLAs, and as the subtle erosion of confidence in the monitoring infrastructure itself.
Redundant instrumentation compounds this problem at the infrastructure layer. Duplicate metric collection agents consume CPU and memory on every host they run on. Excessive cardinality in time-series databases drives up storage costs and query latency. A team that ingests ten times more data than it actually queries is not operating a more reliable system — it is operating a more expensive one.
Recognizing the Warning Signs
Before an organization can address observability debt, it needs to recognize where it has accumulated. Several indicators are worth examining during any honest assessment.
Dashboard utilization rates are among the most telling signals. Most observability platforms expose usage metadata, and the data is frequently sobering. In environments where dashboards have proliferated without governance, it is not uncommon to find that thirty to forty percent of existing dashboards have received zero views in the past sixty days. These are not dormant assets — they are active liabilities, consuming storage and maintenance cycles while providing no operational value.
Alert-to-action ratios reveal a different category of debt. When a significant proportion of triggered alerts result in no engineering action — either because they are acknowledged and closed without investigation or because they fire during periods when no one is watching — those alerts are not protecting the system. They are conditioning the team to ignore the monitoring infrastructure.
Agent sprawl is the infrastructure-layer equivalent of dashboard proliferation. When multiple collection agents run on the same host, sending overlapping telemetry to different backends, the cost is paid in compute, in network egress, and in the engineering time required to reconcile data that should never have been duplicated in the first place.
A Framework for Auditing Your Monitoring Stack
Addressing observability debt requires a structured audit, not a wholesale replacement. Ripping out existing tooling in favor of a new platform solves the immediate fragmentation problem while typically generating its own category of debt during the migration period. A more durable approach proceeds in phases.
Phase one: inventory. Document every observability tool currently in use, the data sources each tool ingests, the teams that depend on each tool, and the monthly cost — including both licensing and infrastructure overhead — associated with each. This step alone frequently surfaces redundancies that were invisible when each tool was evaluated in isolation.
Phase two: utilization analysis. For each tool, pull utilization metrics. How many dashboards exist? How many have been accessed in the past thirty days? How many alerts are configured? What percentage of those alerts resulted in human action over the past quarter? What is the ratio of ingested data to queried data? The answers to these questions will identify where the debt is densest.
Phase three: consolidation planning. Armed with inventory and utilization data, the team can make evidence-based decisions about which tools to retain, which to deprecate, and where consolidation is feasible. This is also the appropriate moment to establish governance policies — ownership requirements for dashboards, mandatory review cycles for alert configurations, and instrumentation standards that prevent future accumulation.
Phase four: ongoing maintenance. Observability debt, like technical debt in any other domain, returns if the conditions that created it are not addressed structurally. Automated reporting on dashboard utilization, quarterly alert reviews, and clear ownership assignments for monitoring artifacts are the mechanisms that prevent the next accumulation cycle.
The Operational Case for Consolidation
The argument for consolidating a fragmented monitoring stack is sometimes framed as a cost-reduction exercise. That framing is accurate but incomplete. The more compelling argument is operational: engineers who trust their monitoring infrastructure make better decisions during incidents. Teams that operate fewer, well-maintained dashboards spend less cognitive effort navigating their observability environment and more effort addressing the conditions that triggered an alert.
Observability is only valuable insofar as it informs action. A monitoring stack that has accumulated years of unmaintained artifacts, redundant instrumentation, and overlapping alert configurations does not make a system more observable — it makes the operational picture harder to read. The cost of that obscurity is measured not in dollars alone, but in every incident that ran longer than it needed to because the team could not trust what their dashboards were telling them.
Auditing your monitoring stack is not a project for a slow quarter. It is a prerequisite for operating with confidence.